Alert rules
Create an alert rule in Maple: pick what to watch, set warning and critical thresholds, choose who gets notified, and replay the rule against past data. In the app or over the API.
An alert rule watches one signal, checks it against a threshold on a fixed interval, and opens an incident when the threshold is crossed for long enough. Each incident notifies the destinations attached to the rule.
You manage rules under Alerts → Rules in the sidebar. Creating, editing and deleting rules requires the engineer or admin role in the organization.
Prerequisites
- Telemetry arriving in Maple. Built-in signals read traces.
- At least one notification destination or escalation chain, or the engineer or admin role to add a destination from the editor. A rule cannot be saved without one of them.
Create a rule
- Open Alerts and click New rule. To start from a service, open the service and click Create alert, which fills in the service. The arrow next to New rule also offers Anomaly rule, Uptime check and SLO.
- Start with a template opens first. Pick a template, or Start blank. Every field a template sets stays editable.
- Fill in the four cards of the editor: When (what to watch), Alert when, Notify and Name. A complete card closes to a one-line summary; click it to open it again.
- Check the chart above the cards. It replays the rule against past data as you edit.
- Click Create rule.
To alert on a dashboard chart instead, open the chart’s menu on the dashboard and choose Create alert. The rule opens with the chart’s query.
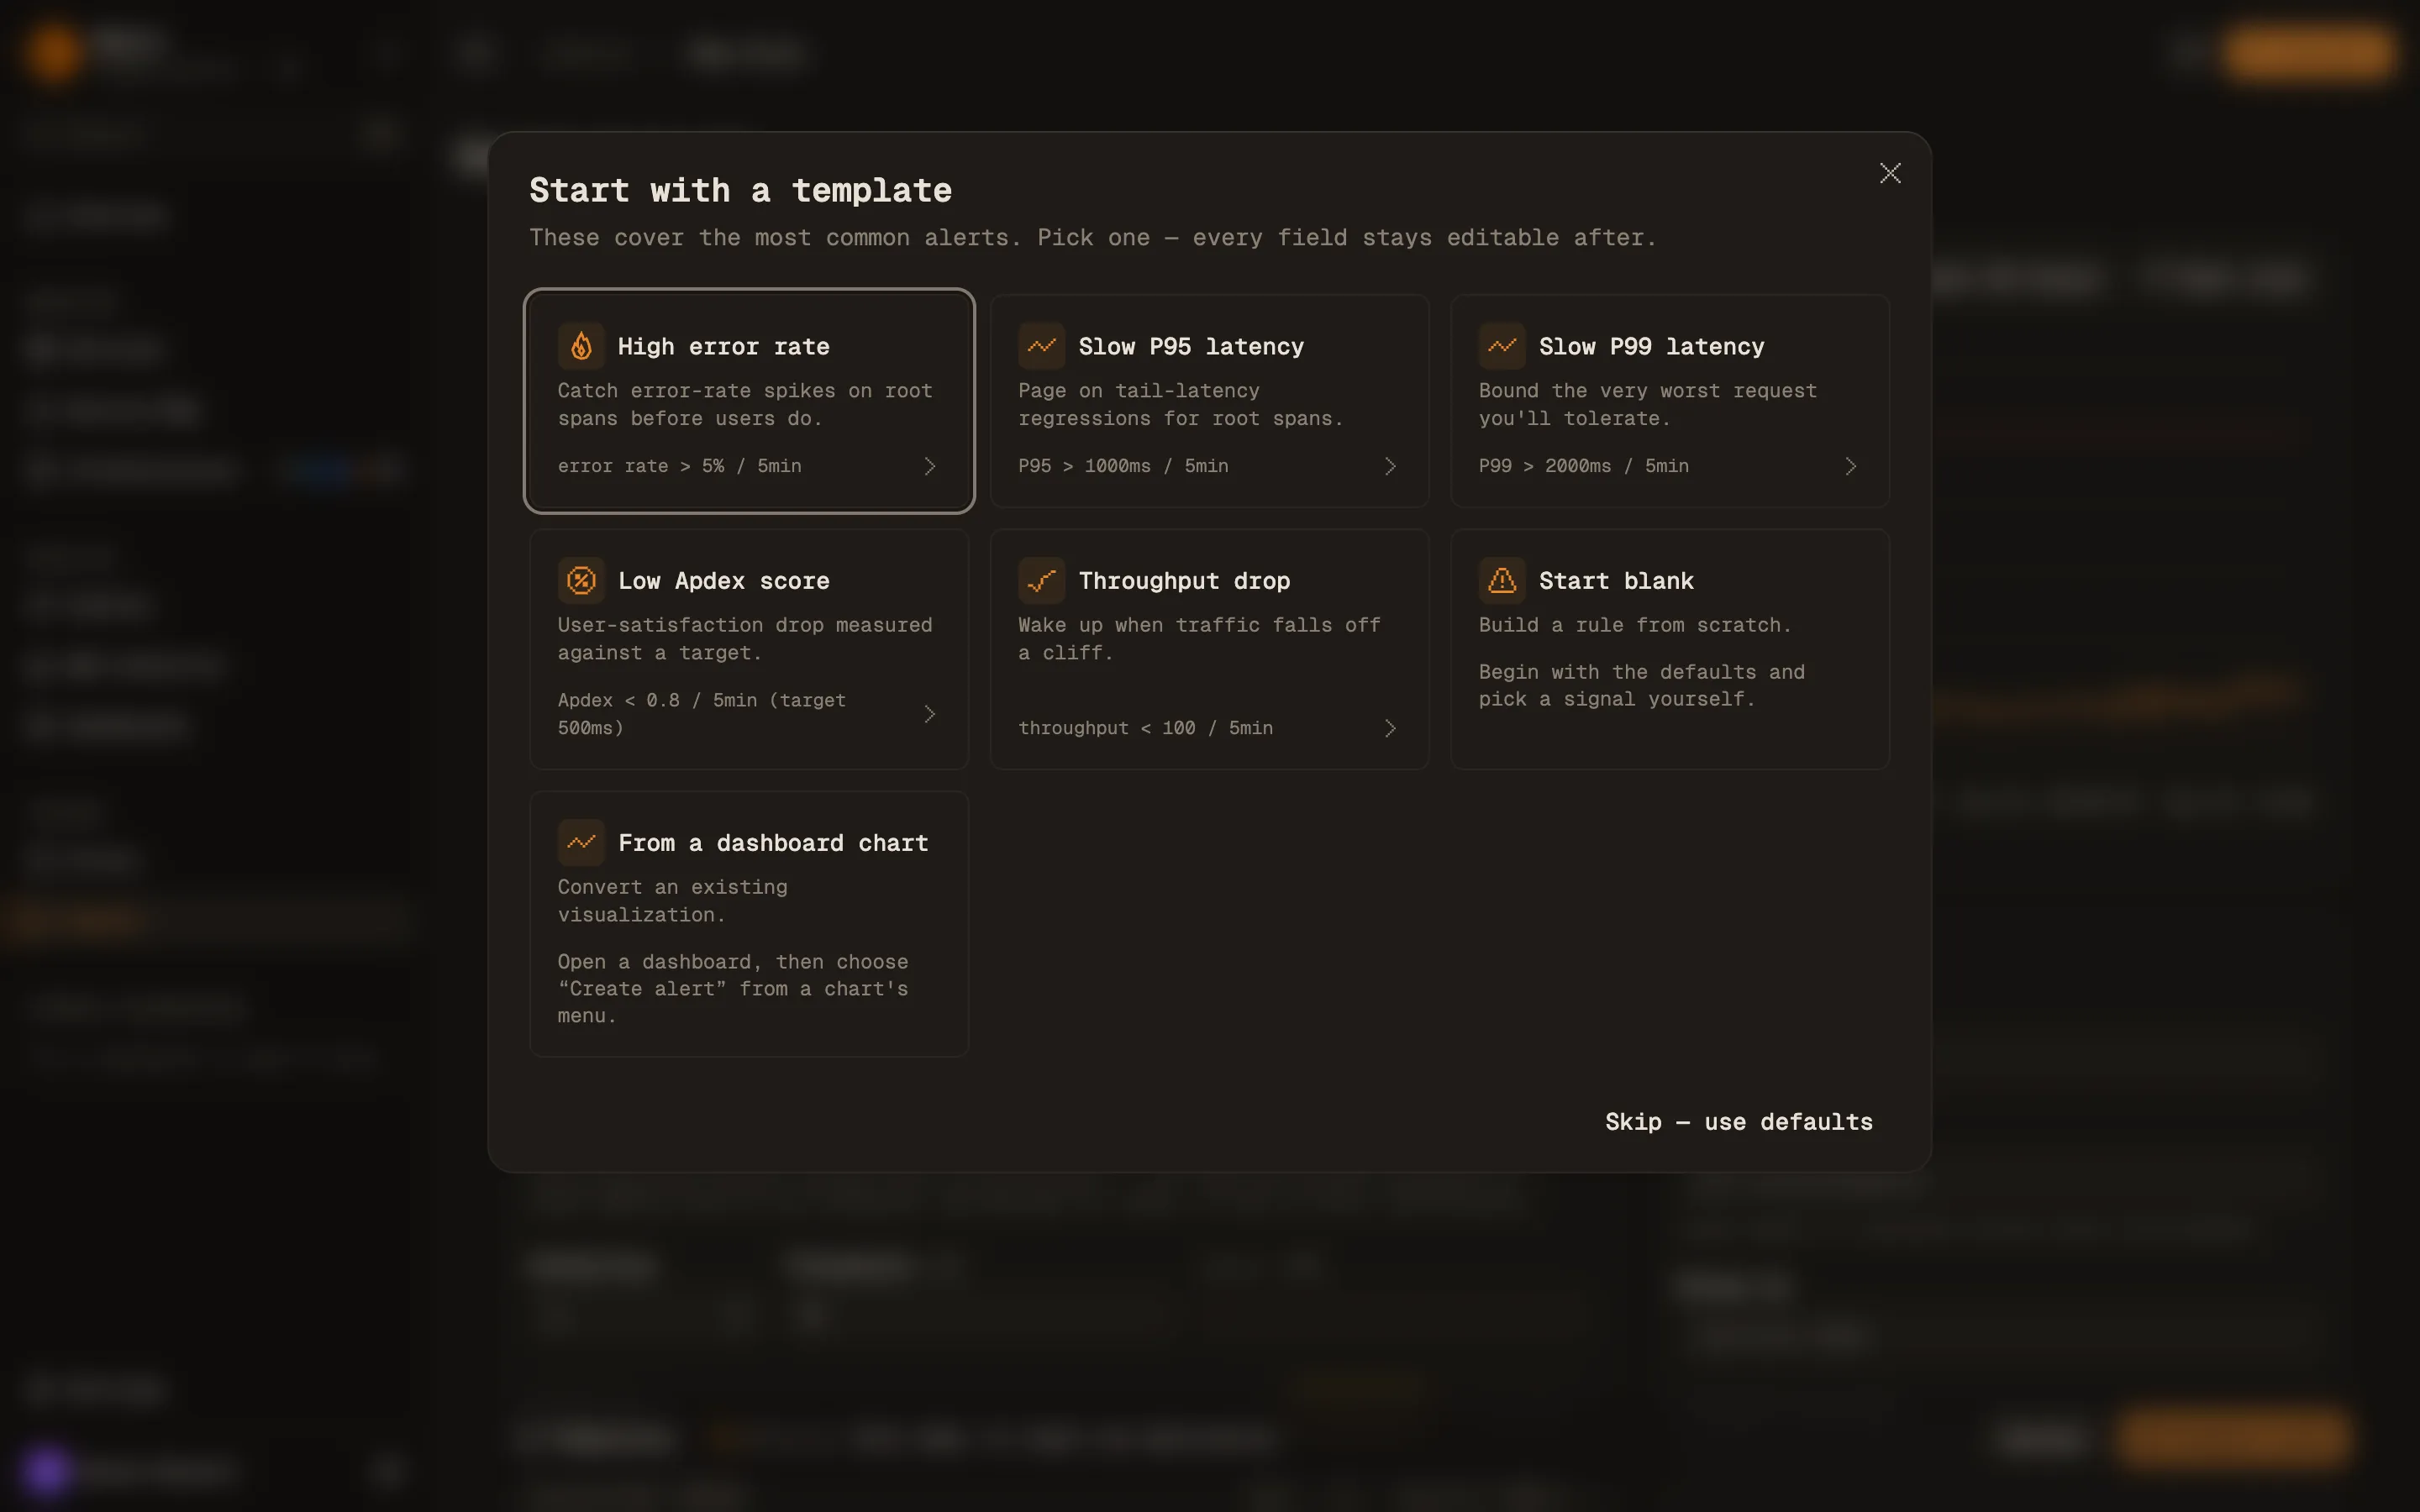
| Template | Signal | Fires when | Window | Also sets |
|---|---|---|---|---|
| High error rate | Error rate | above 5% | 5 min | Split by service.name when no service is set |
| Slow P95 latency | P95 | above 1000 ms | 5 min | |
| Slow P99 latency | P99 | above 2000 ms | 5 min | |
| Low Apdex score | Apdex | below 0.8 (T 500ms) | 5 min | |
| Throughput drop | Throughput | below 100 | 5 min | Minimum samples 0 |
Cancel closes the picker and keeps the blank rule. Templates in the bar at the bottom of the editor opens it again.
When: what to watch
The Query mode is Built-in, Query builder, SQL or Anomaly. A blank rule opens in Query builder. The templates use Built-in.
Built-in
Built-in signals read the entry-point spans of each service: server and consumer spans, and trace roots. That is the same set of requests the service pages chart.
| Signal | API value | Value compared against the threshold |
|---|---|---|
| Error rate | error_rate | Share of requests with status Error. Entered as a percent in the app, a 0 to 1 ratio in the API. |
| P95 | p95_latency | 95th percentile duration, in milliseconds. |
| P99 | p99_latency | 99th percentile duration, in milliseconds. |
| Apdex | apdex | Apdex score from 0 to 1, against the Apdex target. See Apdex alerts. |
| Throughput | throughput | Estimated number of requests in the window. |
Counts and rates are weighted for sampling. See Sampling and throughput.
A built-in signal only sees entry-point spans. A service that records a failure on a child span and still returns success from its entry point stays healthy on these signals. Use Query builder or SQL for that case. Open in query builder turns the current signal into a query.
Built-in rules pick their services and environments here:
- Services. Empty means every service. When you pick more than one service, Maple evaluates each service on its own and opens a separate incident per service.
- Environment. Empty means every environment. Otherwise the rule only counts spans from the listed deployment environments (
deployment.environment.name). - Split by. With no services selected, a field such as
service.nameor an attribute likeattr.http.routeevaluates each group on its own. You get one incident per group that breaches, instead of one blended value that may never cross the threshold. - Exclude. Skips named services. It only applies when no services are selected.
Query builder
Query builder (builder_query) uses the same query builder as dashboard charts. It can read traces, logs, metrics or product events, with its own filters and group-by. Each group is checked on its own and gets its own incident.
SQL
SQL (raw_query) runs your own ClickHouse SQL. The query must include $__orgFilter and a $__timeFilter(...) on the time column, and return a time bucket and a numeric value. Reduce each window by turns the buckets in the window into one value: Last bucket, Sum, Average, Minimum or Maximum.
- To evaluate several groups, return a
groupcolumn. - Return a
samplescolumn with the number of events behind each row. Minimum samples sums it. Without it, every row counts as one sample, so the minimum counts buckets rather than events. - A query that returns no rows is a no-data check.
The editor times the query as you write it and shows Query time against the limit of the check interval. See the SQL reference for the macros, and Query time limits for the limits.
For Query builder and SQL rules the query carries its own filters, so the service and environment fields are hidden.
Anomaly
Anomaly (anomaly) has no query and no threshold. It notifies when Maple’s anomaly detection opens an anomaly in the rule’s scope: Services, Environment and Signals (Error rate, p95 latency, Throughput, Error spikes, Log volume). An empty field covers every value, but a new rule needs at least one of them set. The organization’s default anomaly rule already covers everything, and the most specific rule handles each anomaly. The chart and the Alert when card are not shown for this mode.
Alert when
The chart above the cards replays the rule over a past range. It shows the value for each window, the threshold as a dashed line, and shaded bands where the rule would have held an incident open. The header reads Would have fired with a count, or No breaches in this window. Pick the range in the time picker above the chart.
Dry run evaluates the rule once against current data and shows the value with Would trigger or Within threshold. Neither the chart nor the dry run sends a notification.
The Alert when card has three parts:
- Thresholds reads as a sentence: the Severity (Warning or Critical), then when the value, the condition and the value. The condition is one of: is above, is at or above, is below, is at or below, equals, is not, is between or is outside. The last two use From and To. The above and below conditions also take an optional recovery value (Recovers below or Recovers above). With one set, the incident clears only once the signal crosses back over it.
- How it is checked sets the window, how many breaches open an incident, the sample floor and the check interval.
- After it fires sets when the incident resolves, how often it reminds, and what an empty window means.
Warning and critical tiers
A rule starts with one tier. On a Warning rule, Add critical tier adds a second, stricter threshold. An open incident escalates to Critical when the value crosses it, and drops back to Warning when it recovers. Each tier has its own recovery value and its own destinations, and a critical incident also notifies the warning tier’s destinations.
Tiers work with the above and below conditions. Equals, is not, is between and is outside have one tier, and saving drops a critical tier.
Fields and defaults
How it is checked
| Field | Default | API field | What it does |
|---|---|---|---|
| Window | 5 min | window_minutes | Length of the window each check aggregates. 1 to 1440 minutes. |
| Breaches to fire | 2 | consecutive_breaches_required | Breaching checks before an incident opens. |
| Out of the last | In a row | breaches_out_of | Fire when Breaches to fire of the last N checks breach, instead of in a row. 1 to 30. |
| Minimum samples | 50 | minimum_sample_count | A window with fewer samples is skipped and cannot fire. |
| Check every | Auto | evaluation_interval_minutes | 1, 5, 10, 15, 30 or 60 minutes. Auto is a fifth of the window, from 1 to 5 minutes. |
After it fires
| Field | Default | API field | What it does |
|---|---|---|---|
| Resolve after | 2 | consecutive_healthy_required | Healthy checks in a row before an incident resolves. |
| Remind while open, every | 30 min | renotify_interval_minutes | How often an open incident notifies again while it keeps breaching. |
| Alert when there is no data | Off | alert_on_no_data | Count an empty window as a breach. Off, those windows are skipped. |
Over the API, minimum_sample_count defaults to 0. The other API defaults match the editor.
For a Throughput drop rule, set Minimum samples to 0, as the Throughput drop template does. With 50, a window under 50 requests is skipped, so a full outage cannot fire. How alert rules are evaluated covers skipped windows, no data and the check interval in detail.
Notify
Click Add destination to attach an existing destination, or create one from the same menu. With a critical tier, the section has one list for Warning and one for Critical, on top of the warning destinations.
Escalation chain pages the steps of an escalation chain instead of, or as well as, the destinations. Create chains under Alerts → Routing. A rule needs a destination or a chain.
Send test delivers a test notification for this rule to the selected destinations.
Message template customizes the Title and Body (Markdown) of Slack, Hazel, Discord, Telegram, Google Chat, Microsoft Teams, PagerDuty, incident.io and Linear notifications with {{ variable }} substitution, for example {{ rule.name }}, {{ value }} or {{ links.app }}. Leave it blank for the built-in format. Email and webhook destinations always use the built-in format.
Name
Rule name is required. Tags (up to 20, each up to 32 characters) group and filter rules in the alerts list. Add notes opens a free-text Notes field for runbook links or ownership.
The bar at the bottom of the editor reads Ready to save, or lists what is still missing. Click Create rule, or Save changes on an existing rule.
Create a rule over the API
Rules are available at /v2/alerts/rules on https://api.maple.dev (https://api.eu.maple.dev for EU organizations). Use an API key (maple_ak_…) from Settings → Keys. Creating, updating, deleting and testing a rule requires the alerts:write scope and the engineer or admin role.
curl -X POST https://api.maple.dev/v2/alerts/rules \
  -H "Authorization: Bearer maple_ak_…" \
  -H "Content-Type: application/json" \
  -d '{
    "name": "Checkout error rate",
    "signal_type": "error_rate",
    "comparator": "gt",
    "threshold": 0.05,
    "window_minutes": 5,
    "service_names": ["checkout"],
    "environments": ["production"],
    "severity": "critical",
    "minimum_sample_count": 50,
    "destination_ids": ["dest_oybbpTBhtSFGShMjjLiCrh"]
  }'
Error rate thresholds are 0 to 1 ratios in the API (0.05 is 5%). destination_ids must name at least one existing destination.
For a warning and a critical tier, send thresholds in place of severity, threshold and destination_ids. Tiers go lowest first, at most one of each severity:
"thresholds": [
  { "severity": "warning", "value": 0.02, "destination_ids": ["dest_oybbpTBhtSFGShMjjLiCrh"] },
  { "severity": "critical", "value": 0.05, "recovery_value": 0.03, "destination_ids": ["dest_4tqzJ2bXvN8yWkLmPa6sRc"] }
]
To preview a rule over a past range, POST /v2/alerts/rules/preview with the rule under rule and the range in start_time and end_time. It needs the alerts:read scope and sends nothing.
curl -X POST https://api.maple.dev/v2/alerts/rules/preview \
  -H "Authorization: Bearer maple_ak_…" \
  -H "Content-Type: application/json" \
  -d '{
    "rule": {
      "name": "Checkout error rate",
      "signal_type": "error_rate",
      "comparator": "gt",
      "threshold": 0.05,
      "window_minutes": 5,
      "service_names": ["checkout"],
      "severity": "critical",
      "destination_ids": ["dest_oybbpTBhtSFGShMjjLiCrh"]
    },
    "start_time": "2026-07-14T00:00:00.000Z",
    "end_time": "2026-07-15T00:00:00.000Z"
  }'
The response lists the value and status of each window per group in series, and the spans where an incident would have been open in would_fire.
POST /v2/alerts/rules/test evaluates a rule once against current data. Set send_notification to true to also deliver a test notification. See the API reference for every endpoint and field.
Audit log detections
A detection is an alert rule that counts audit events. It fires when a set number of matching events arrive within a window, for example 5 or more failed sign-ins in 10 minutes. It is not one of the query modes above: organization admins create, edit and delete detections under Security → Detections, and the alert rules API does not create or change them.
A detection matches events by Platform, Category and Outcome, each of which can stay on Any, and optionally by one exact Action, written as the platform names it, such as team.member.role.updated. With no filters it counts every audit event. It cannot match on who acted: a detection never names a person.
| Field | Values |
|---|---|
| Count | 1 to 100,000 events |
| Window | 5 minutes to 24 hours |
| Severity | Warning or Critical |
| Notify | Up to 20 notification destinations, or none |
An organization can have up to 50 detections. Each one is checked every minute.
There are two ways to start one:
- Open Security → Detections and click New detection. While the organization has no detections, the page lists five ready-made ones: a member added or removed, a permission or role changed, a credential created, rotated or revoked, a burst of refused requests, and repeated sign-in failures. Picking one fills in the editor. Nothing is created until you save.
- Filter the audit log under Security → Audit log and click Alert on these events. The editor opens with the platform, category and outcome you filtered by. An actor filter is not carried over.
When a detection fires it opens an incident and notifies its destinations. The notification carries the number of matching events, never an event or who caused it. A detection with no destination still opens the incident, and nobody is notified.
Every member of the organization can see a detection’s name and that it fired. The events it counted are in the audit log, which only organization admins can read.
Deleting a detection also deletes the incidents it opened, open ones included.
Troubleshooting
- The rule never fires. Open the rule and look at its Checks. Skipped checks mean the window had no data or fewer samples than Minimum samples. In the editor, the chart says how many windows would be skipped and why. Check the service names and environments against what is arriving.
- The rule fires and resolves over and over. Raise Breaches to fire and Resolve after, or widen the window.
- Save is disabled. The bar at the bottom of the editor lists what is missing, such as a rule name, or a destination or escalation chain.
Next steps
- How alert rules are evaluated: skipped windows, no data, the check interval and query limits.
- Incidents: what happens after a rule fires.
- Apdex alerts: choosing the target and threshold for an Apdex rule.
- Uptime monitoring: availability alerts from traces, and HTTP checks from the OpenTelemetry Collector.
- Notification destinations: where notifications go.